> We're looking to write some scripts to present various rush data
> in HTML format [via a cgi-bin script], and were wondering if you
> have any examples that show how to present the rush reports graphically,
> such as the 'rush -laj' data?
It's easy to do; you can simply parse the 'rush -laj' report,
and re-write it in HTML, using eg. tables to make the 'graphs'.
It can be done in pure html, using colored tables to do the bargraphs,
no image data is necessary.
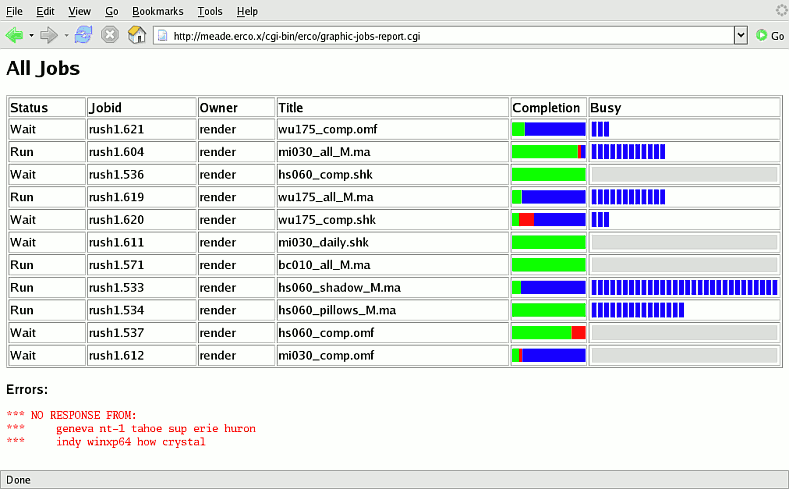
Here's a simple example I just whipped up; first, a screen-shot:
http://seriss.com/rush-current/examples/graphic-jobs-report/graphic-jobs-report.png
..where:
The 'Completion' column shows the %DONE/%FAIL data as bar graphs;
Red=fail, Green=done, Blue=still queued
The 'Busy' column shows busy cpus;
one blue box for every cpu currently rendering the job.
This is a pretty simple script, even with all the whiz-bangs to show
error messages separately, and handle column formatting.
Here's the actual cgi-bin script:
http://seriss.com/rush-current/examples/graphic-jobs-report/graphic-jobs-report-pl.txt
..completely standalone and self contained, which you can just
'drop' into your cgi-bin directory:
You can do the same thing for the rush cpu.acct accounting data;
see this previous newsgroup article for details:
http://seriss.com/cgi-bin/rush/newsgroup-threaded.cgi?-view+1120
These scripts don't have to be written in perl; you can use python,
php, etc.
|